Blogs

Economic Indicators during the Roaring Twenties and Great Depression (III).

Previously in Part I of this series, I explained the need to re-examine economic indicators to determine how they performed in previous periods of deflation. In Part II, I looked at the year-over-year M1 vs. CPI indicator during the Roaring Twenties. That examination showed that, in the 1920s, the M1 vs. CPI indicator generally worked well, with two differences from the Inflationary Era: (1) if anything, the indicator slightly lagged signaling the start of recessions, and led signaling expansions; and (2) when M1 was not growing -- when it was stagnant or declining -- it did not signal expansion even though its YoY change was less negative than a CPI deflation.

III. Great Depression, post WW 2 deflation -- monetary indicators

In this installment I will look at the same M1 vs. CPI indicator during the Great Contraction and New Deal portions of the Great Depression, and the brief post World War 2 deflation of 1948-49 (the last significant period of deflation before now).

Before we examine the Great 1929-1932 Contraction, let's look at the Recesion of 1937-38 (as previously, YoY M1 is in blue, CPI is in red):

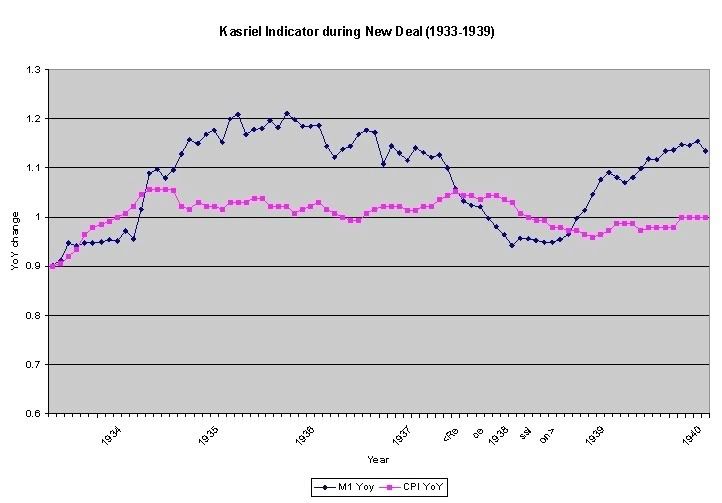
As with the Roaring Twenties, our monetary indicator works flawlessly here, with M1 declining below CPI in June 1937, only one month after the onset of the recession in May 1937, and exceeding CPI in August 1938, two months after its end in June 1938.

What is in The Economic Stimulus Bill of 2009, Part II

The post is an update to What is in the Economic Stimulus Bill of 2009?.

Tracking on Congress is like a sing along with 1 million people out of tune and out of sync. So, we'll do our best to give you the latest amendments, bill text and analysis.

The Bill

The bill title is American Recovery and Reinvestment Act of 2009.

The bill number is H.R. 1 (this is a huge pdf).

The Senate is working on it's own version and that bill number is S.1.

Where to find the latest amendments? Currently the 206 amendments are here.

Social unrest spreads in Europe

By now we are all familiar with the fact that Iceland's government has collapsed amidst a financial failure and popular protests.
What isn't as well-known is that this appears to be merely the start of a tsunami of street protests, general strikes, and riots that will rock Europe for months (and maybe years) to come.

The problem is especially troublesome in eastern Europe, where it is likely that governments will topple before the economic crisis is over.

Who will benefit from nationalization of finance?

I put this up yesterday on DailyKos. It did not get much traction, but I think it is important to get people thinking about the issues raised. In short, the success of both the two-pronged bank bailout (TARP and the Fed’s largesse), and the stimulus bill, are going to depend on whether or not the U.S. economy is transformed. I don’t think there is much disagreement in the direction we need to shove the U.S. economy; BruceMcF has done a brilliant job of discussing some of the more important aspects of transportation.

Weekly Audit: Obama's Stimulus Plan Signals End of Era

by Zach Carter, Media Consortium MediaWire Bloggger

Since the U.S. is officially in a recession, and the Congressional Budget Office has predicted the worst economic downturn since the Great Depression, just about everybody acknowledges that times are tough. Everybody, that is, except the National Republican Congressional Committee. Talking Points Memo's David Kurtz caught the Republican fundraising operation spouting some embarrassing doubletalk on their website earlier this week, including the proud declaration that "the U.S. economy is robust and job creation is strong."

In fact, job creation is non-existent. The U.S. economy is losing over half a million jobs every month and even optimistic Wall Street economists expect unemployment to keep rising for at least another year.

Economic Indicators during the Roaring Twenties and Great Depression (II).

Yesterday I discussed the need, given our deflationary recession, to examine the reliability of economic indicators during past periods of deflation, specifically to the period from 1920 to 1950. Today I begin that examination with the 1920s.

II. The Roaring Twenties: monetary indicators

The Roaring Twenties was an era of productivity- and debt- fueled urban prosperity that contemporaries called "The New Era" in which supposedly all of humanity's economic problems had been solved. Little did people at the time know of the severe hardships that awaited them when the bubble burst. Monetarily the decade was begun with the bursting of World War 1's high inflation (much like Paul Volker was to burst 1970s' inflation 60 years later), that settled into disinflation (declining inflation) and finally into deflation.

Today I will examine the monetary component of Paul Kasriel's "infallible recession indicator" as applied to the 1920s.

Planes & Body Counts - A Rant on the Executive Class

This is war. Class war. Class warfare. Let's just call it what it is, for some reason the minute any person gets the title executive they somehow have entered some global boys club, thinking they can just rob the nation, their share holders and especially their employees blind...and it simply has to stop!

Citigroup

just plane despicable

The New York Post calls it: Just Plane Despicable

Citigroup buys a Corporate Jet! It's not even American made, it's French!

Gather says it best:

Economic Indicators during the Roaring Twenties and Great Depression (I).

I. Introduction

The supporting data normally cited in the welter of economic commentary suffers from an important limitation. Almost all of those indicators date from the 1950s and 1960s onward. That is to say, they cover a period where there was not even one single deflationary event. All of their reliability comes from a period of waxing and waning inflation -- but always inflation. As we are experiencing the most significant deflationary recession since the Great Contraction of 1929-32 and the Post World War 1 deflation of 1920-21, the applicability of these indicators is very suspect.

This point was driven home to me when I saw a graph of one such very reliable post-war indicator -- the yield curve -- dating from 1929. The graph re-posted below, shows a relentlessly positive yield curve (short term rates are in green, long term rates in red).

If one were ignorant of history, one would have expected that with the exception of a couple of brief bumps, the economy would have been expanding nicely throughout the entire period from 1929-1950! Even during most of the "great contraction" of 1929-32, the yield curve was positive.

Sunday Morning Comics - The Outsourced Edition

Sponsored by The Outsourcing Industry - By outsourcing, I got this blog post for just 2¢
not responsible for political incorrect statements, inappropriate content, material not appropriate for all cultures, cross border sourcing gives no warranties, and is not liable for content and if we are, good luck finding us, we're in another country. Can't read this, didn't think so, you're not supposed to be able to read fine print, that's the entire point. All parties not responsible for inaccurate display of fine print so it is actually readable

Cup O' Joe


Good Morning! Rise and Shine! Get that Cup O' Joe...
break out the O.J....hang out with the pooch...time to check out the Funnies!


Pages