New Deal democrat's blog

Economic Indicators during the Roaring Twenties and Great Depression (III).

Previously in Part I of this series, I explained the need to re-examine economic indicators to determine how they performed in previous periods of deflation. In Part II, I looked at the year-over-year M1 vs. CPI indicator during the Roaring Twenties. That examination showed that, in the 1920s, the M1 vs. CPI indicator generally worked well, with two differences from the Inflationary Era: (1) if anything, the indicator slightly lagged signaling the start of recessions, and led signaling expansions; and (2) when M1 was not growing -- when it was stagnant or declining -- it did not signal expansion even though its YoY change was less negative than a CPI deflation.

III. Great Depression, post WW 2 deflation -- monetary indicators

In this installment I will look at the same M1 vs. CPI indicator during the Great Contraction and New Deal portions of the Great Depression, and the brief post World War 2 deflation of 1948-49 (the last significant period of deflation before now).

Before we examine the Great 1929-1932 Contraction, let's look at the Recesion of 1937-38 (as previously, YoY M1 is in blue, CPI is in red):
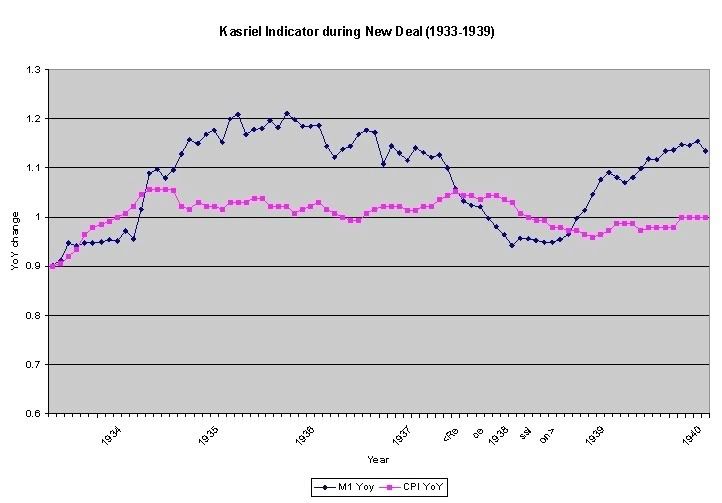
As with the Roaring Twenties, our monetary indicator works flawlessly here, with M1 declining below CPI in June 1937, only one month after the onset of the recession in May 1937, and exceeding CPI in August 1938, two months after its end in June 1938.

Economic Indicators during the Roaring Twenties and Great Depression (II).

Yesterday I discussed the need, given our deflationary recession, to examine the reliability of economic indicators during past periods of deflation, specifically to the period from 1920 to 1950. Today I begin that examination with the 1920s.

II. The Roaring Twenties: monetary indicators

The Roaring Twenties was an era of productivity- and debt- fueled urban prosperity that contemporaries called "The New Era" in which supposedly all of humanity's economic problems had been solved. Little did people at the time know of the severe hardships that awaited them when the bubble burst. Monetarily the decade was begun with the bursting of World War 1's high inflation (much like Paul Volker was to burst 1970s' inflation 60 years later), that settled into disinflation (declining inflation) and finally into deflation.

Today I will examine the monetary component of Paul Kasriel's "infallible recession indicator" as applied to the 1920s.

Economic Indicators during the Roaring Twenties and Great Depression (I).

I. Introduction

The supporting data normally cited in the welter of economic commentary suffers from an important limitation. Almost all of those indicators date from the 1950s and 1960s onward. That is to say, they cover a period where there was not even one single deflationary event. All of their reliability comes from a period of waxing and waning inflation -- but always inflation. As we are experiencing the most significant deflationary recession since the Great Contraction of 1929-32 and the Post World War 1 deflation of 1920-21, the applicability of these indicators is very suspect.

This point was driven home to me when I saw a graph of one such very reliable post-war indicator -- the yield curve -- dating from 1929. The graph re-posted below, shows a relentlessly positive yield curve (short term rates are in green, long term rates in red).

If one were ignorant of history, one would have expected that with the exception of a couple of brief bumps, the economy would have been expanding nicely throughout the entire period from 1929-1950! Even during most of the "great contraction" of 1929-32, the yield curve was positive.

Housing slump now the Worst since the Great Depression

This morning the Census Bureau reported housing starts for December 2008. The number, 550,000 units, was considerably worse than the already expected number. Which means we have passed a milestone. We are now officially in the worst housing slump since the Great Depression.

Almost exactly a year ago, I wrote a diary entitle, The worst housing slump since the Great Depression? which noted that, at that point, the housing decline was on par with the worst since World War 2, and was likely to worsen.

Here's the data I cited:
In December 2007, an annual rate of 604,000 new single family houses were started. This is a dramatic decline of (-56.5%) from the all time high of 1,389,000 annual rate of starts only 17 months ago in July 2005.

Why the Deflationary Recession of 2009 isn't just about Oil

When I diaried last week that we were in the midst of the biggest deflation since the Great Depression, I was met by a number of naysayers (at another blog) who criticized the diary on the grounds that the deflation was just the artifact of the bursting of the Oil bubble, nothing more.
That is not the case. We are undergoing a real deflation for the first time in over 50 years because consumers are full of debt and tapped out of cash, their assets (homes and stocks) are going down in price, and they are unable or unwilling to spend the money they have begun to save at the gas pump. With consumers not buying, demand for manufactured goods has cratered as well. I'll show why below the fold.

The -In- DEflation Outlook for 2009

Here is a screen shot of the monthly readings of CPI for the last 3 years:

I include this because if you keep in mind what has been happening with Oil prices over that same time, a pretty decent picture of what is likely to happen to prices in 2009 takes shape. Remember that from August 2006 through January 2007, Oil prices decreased over 35% from $80 to under $55. Then Oil took off on a tear, hitting $147.50 in July 2008, before collapsing to under $35 by the end of the year. Oil prices are seasonal, rising in the first half of the year, and dropping in the later part of the year, and this is reflected in the "seasonal adjustment" of consumer prices.

The Deflationary Bust deepens

Consumer prices in December fell ( -1.0 %) non-seasonally adjusted. Inflation for the entire year 2008 was 0,1%! (meaning I have officially won my bet wtih Bonddad). In the first seven months of the year, driven by soaring gas prices, inflation surged 4.6%. And then the deflationary bust hit. In the last 5 months, prices have fallen ( - 4.4 %), or at an annual rate of ( - 11.0%). Here is how our Deflationary Recession compares with others from the past 100 years, as of year end 2008:

Recession dates/ YoY, monthly deflation/greatest +/- change

Recession Time Period -1.5% Deflation Largest Change
1/13 - 12/14 2 - 4/14 (-3.0%)
8/18 - 3/19 n/a (inflationary) +23.7%
1/20 - 7/21 8/20 - 9/22 (-15.8%)
5/23 - 7/24 4/24 (-1.8%)
10/26 - 11/27 1 - 5, 8/27 (-3.4%)
n/a 6/28 (-2.8%)
8/29 - 3/33 4/29, 3/30 - 8/33 (-10.7%)
5/37 - 6/38 1 - 12/38 (-3.4%)
2/45 - 10/45 n/a (inflationary) +2.8%
1/49 - 10/49 1/49 - 1/50 (-3.2%)
7/53 - 5/54 n/a (-.8%)
12/07 - ???? 10/08 - ???? (- 4.4 %)

Monetary Indicators give some hope?

The economy has fallen off a cliff, but there are at least some hopeful indications that we might not have too much further to fall. Both Calculated Risk and Econbrowser have posted graphs indicating that the severe credit crunch evident during September has eased, and while the indicators haven't gone back to normal, they are at least out of the panic zone.

In addition to those, both monetary indicators I have been tracking now point to recovery.

The Great Depression, Part 4

In Part I of this series, Bonddad and I looked at the years 1929 - 1933. These years saw a decline of 25% in the chained GDP figures; a failure of 20% of commercial banks, a drop in personal income from $90 billion to $50 billion and a drop in the level of industrial production from 60 to 30. In
part II
we looked at the years 1934 - 1940, where we saw that growth returned to 1929 levels in 1937, although this was lowered by the recession of 1938. By 1939 GDP was again increasing. In Part III, we looked at what happened statistically and practically during the years of 1934 - 1938.
In this, our 4th and final installment, we expose and rebut the lies and distortions of the RW noise machine New Deal denialists.

Pages