Q4 GDP 2010 came in at 3.2%.. Q4 GDP increased 2.8% in comparison to the 4th quarter of 2009. Here is the original BEA GDP report.
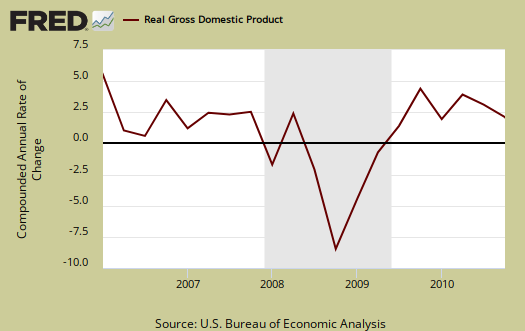
For the entire year, GDP increased 2.9% in 2010. This is in comparison to -2.6% annual GDP growth for 2009. While the press is jumping up and down over the largest GDP growth since 2005, look at the annual GDP growth for the last 20 years. We're not in the roaring 90's.

As a reminder, GDP is made up of:
where
Y=GDP, C=Consumption, I=Investment, G=Government Spending, (X-M)=Net Exports, X=Exports, M=Imports*.
Here is the Q4 2010 advance report breakdown of GDP by percentage point contributions:
- C = +3.04
- I = -3.20
- G = -0.11
- X = +1.04
- M = +2.40
Here is the Q3 2010 3rd revision breakdown of GDP percentage points:
- C = +1.67
- I = +1.80
- G = +0.79
- X = +0.82
- M = –2.53
Below are the percentage point differences, or spread between the third and the second revision GDP report components. This represents the change of gross domestic product growth contributions from Q3 to Q4. The change in private inventories was a -5.31 spread and trade was +5.14.
- C = +1.37
- I = -5.00
- G = -0.90
- X = +0.22
- M = +4.93
Changes in private inventories nose dived to subtract -3.70 percentage points from the change in Q4 GDP. Private businesses increased inventories $7.2 billion in Q4, following increases of $121.4 billion in Q3 and $68.8 billion in Q2 2010.

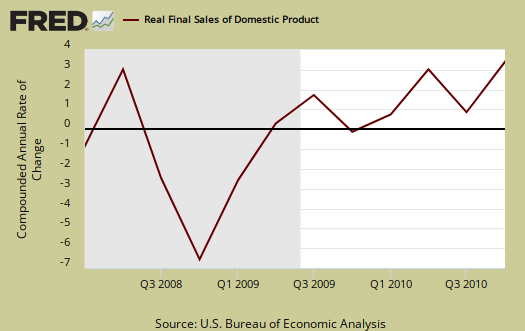
Below are real final sales of domestic product, or GDP - inventories change. This gives a better feel for real demand in the economy. This is the best news of this GDP release, it shows real demand jumped 7.1% in Q4, where Q3 real demand was at 0.9%, or life support.
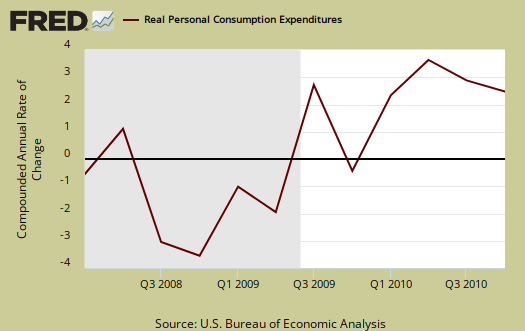
Below the the St. Louis FRED graph for C, or real personal consumption expenditures of the above GDP equation. As we can see from the above, while PCE, or C in the above equation, increased dramatically in Q4.
Below is the breakdown in C or real PCE annualized change. Notice when times are tough, durable goods (bright red) consumption drops. Notice the increase in durable goods this quarter and Durable goods personal consumption was +1.48 percentage points of GDP. I'd claim durable goods implies the public thinks the economy is improving.

You might ask yourself how Imports could possibly add to GDP growth, when the United States runs a monthly trade deficit and imports subtract from GDP. It's due to the change, not the actual absolute deficit totals, which are absurdly high. When imports decelerate, that implies, per that quarter, more domestic goods and services were utilized to generate the changes in the rest of the GDP components. Therefore a deceleration in the trade deficit actually makes a positive contribution to GDP change. Keyword here is change, or growth, versus absolute totals. It's very similar to deceleration of private inventories negative affect on GDP.
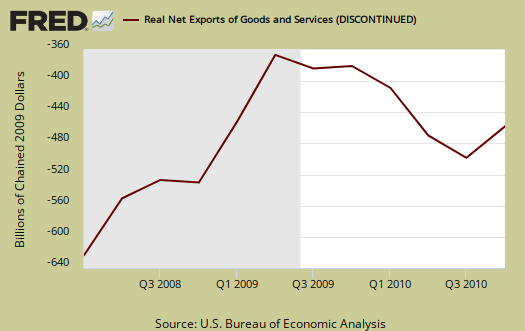
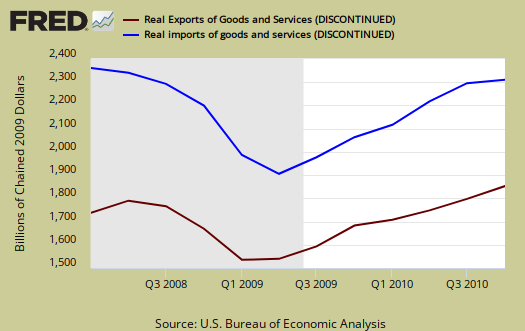
The below graph is real imports vs. exports. While exports increased, it is the trade deficit that matters.
Below are the percentage changes of Q4 2010 GDP components in comparison to the 3rd revision Q3 2010 GDP report:
- C = +4.4%
- I = -22.5%
- G = -0.6%
- X = +8.5%
- M = -13.6%
The BEA's comparisons in percentage change breakdown of 4th quarter GDP components from Q3 2010 are below. Changes to private inventories is a component of I.
C: Real personal consumption expenditures increased increased 4.4% in Q4, compared with an increase of 2.4% in Q3. Durable goods increased 21.6%, compared with an increase of 7.6%. Nondurable goods increased 5.0%, compared with an increase of 2.5%. Services increased 1.7%, compared with an increase of 1.6%.
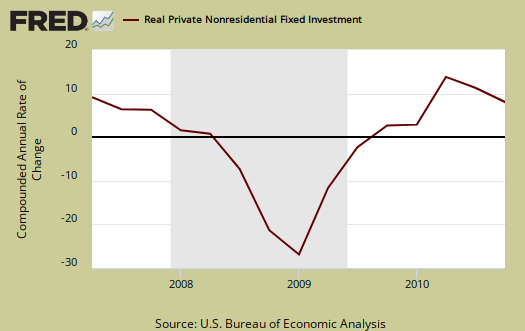
I: Real nonresidential fixed investment increased increased 4.4% in the Q4, compared with an increase of 10.0% in Q3. Nonresidential structures increased 0.8%, in contrast to a decrease of 3.5%. Equipment and software increased 5.8%, compared with an increase of 15.4%. Real residential fixed investment increased 3.4%, in contrast to a decrease of 27.3%.
X & M: Real exports of goods and services increased 8.5% in Q4, compared with an increase of 6.8% in Q3. Real imports of goods and services decreased 13.6%, in contrast to an increase of 16.8% in Q3.
G: Real federal government consumption expenditures and gross investment decreased 0.2% in the fourth quarter, in contrast to an increase of 8.8% in the third. National defense decreased 2.0%, in contrast to an increase of 8.5%t. Nondefense increased 3.7%, compared with an increase of 9.5%. Real state and local government consumption expenditures and gross investment decreased 0.9%, in contrast to an increase of 0.7%.
Motor Vehicles subtracted -0.34 percentage points from Q4 real GDP while computer final sales added +0.31 percentage point changes. This is different from personal consumption, or C auto & parts. Motor vehicles are bought as investment, as fleets by the government and so forth and in Q4, they plain didn't buy much, instead opted for computers. For example in private investment, transportation equipment contributed -0.25 percentage points to Q4 GDP.
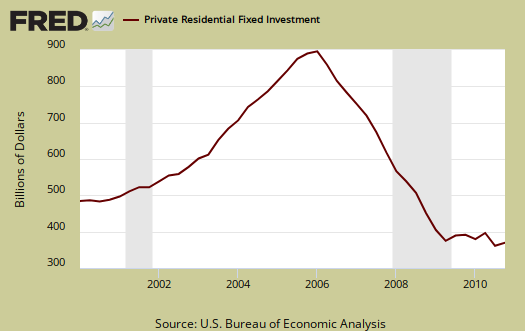
Residential fixed investment added +0.08 percentage points to Q4 GDP after subtracting off -0.75 percentage points in Q3. Below is the raw totals on residential investment. If one could ever see the housing bubble and then it's collapse in terms of economic contributions, the below graph is it. Residential fixed investment is only 2.5% of this quarter's GDP growth.
Private, or not from the government Nonresidential investment is also anemic, with only a 4.4% change from last quarter and only a 13.4% contribution to Q4 GDP.
Real Gross Domestic purchases, which is whatever people in the U.S. bought, regardless of country of origin, decreased -0.3% in comparison of a 4.2% increase in Q3 2010.
The Price index for 2010 increased 1.3% in comparison to 0.2% for 2009. For Q4 2010, the price index increased 2.1%, but minus energy (read gas) and food, the price index increased 1.1% in Q4 2010. In other words, oil prices came to haunt the price index in the last quarter of 2010.
Here are the graphs from Q3 2010 GDP, 3rd revision report.
* In Table 2, the BEA reports GDP contribution components with their equation sign. If durable goods for example, decreased over the quarter or year, it is reported as a negative number. Imports, from the GDP equation, are already a negative for that is not something produced domestically. A negative sign implies imports increased for the time period and a + sign means the change in imports decreased. Or, from the GDP equation: . Confusing but bottom line exports add to economic growth, imports subtract.
Subject Meta:
Forum Categories:
| Attachment | Size |
|---|---|
| 157.25 KB |

trade deficit #1 component to Q4 GDP
I was reading around the Internets and then saw Dean Baker's post on how most analysis of the Q4 GDP report ignore the trade deficit deceleration.
It is the #1 component which created increased GDP growth, #2 being the deceleration (negative) on private inventories.
I'll bet money most financial reports do not even read the BEA report and beyond that, I'll bet they do not understand how the slope, or change of either of these two, private inventories, trade deficit, affects GDP and why that measure is valid.
Inventories are inventories, so people are making stuff and it's sitting around, waiting to be used, that's economic activity, even though it's not a final sale.
The trade deficit represents stuff outside the nation. Gross Domestic Product is Domestic, or what's happening only inside the U.S.A. so a deceleration of the trade deficit means people had to utilize more domestic goods, stuff from the U.S.A. to maintain the same level of economic activity, therefore, a decrease in the trade deficit translates to an increase in what's being produced in the U.S. for that same time period.
It's not intuitive and there is no doubt, understanding the GDP report takes work...
Trade Deficit vs. GDP
Robert,
Your words: "The trade deficit represents stuff outside the nation. Gross Domestic Product is Domestic, or what's happening only inside the U.S.A. so a deceleration of the trade deficit means people had to utilize more domestic goods, stuff from the U.S.A. to maintain the same level of economic activity, therefore, a decrease in the trade deficit translates to an increase in what's being produced in the U.S. for that same time period."
Questions: Would/could inventory "build-ups" in the U.S.A., account for less being purchased from foreign manufacturers? If U.S. markets are not selling what is already on-hand ( in inventory ), where would be the need to order more from abroad? Also, if the GDP shows an ( a significant ) increase for one quarter, does that indicate less demand and dependency on foreign imports?
A big question would be, concerning the products manufactured in the U.S.A., that could possibly lessen our dependency on the same products presently manufactued abroad, what are those products? An increase in GDP doesn't mean that we're producing more of what we're using and consuming. It just means that we're prodicing more of what we don't import. In other words, the increase in GDP doesn't mean that we're building new textile mills, electronic assembly plants, or weaning ourselves away from our dependency on foreign imports.
Our long-running trade deficits do fluctuate, as does the GDP. But, neither fluctuate due to our weaning ourselves from the dependency on foreign imports. We're not taking back the steel, electronics, furniture, tool, toy, and other industries.
While an increase in GDP may have meaning to day traders on Wall Street, until it coincides with "steady decreases" in unemployment and our import dependency, it holds little meaning to John Q. Public on Main Street America.
Because you can do wrong, and get away with it, doesn't make it right
what I think are the questions to what I believe are answers
Ok, firstly I think it needs to be clear what gross domestic product is, GDP means only stuff in this country. I think the BEA this time put a great definition front and center:
So, while we can get into some stuff that is "foreign being counted erroneously, that's what all of this big honkin' bookkeeping is about, they are isolating economic activity to the above.
Inventory build ups are domestic, if there are foreign goods being added to the shelves, they are subtracted off via the import part of the equation. Inventory build up can be for any reason, either they are preparing for more sales in the future, or they are not making enough sales and have not scaled back yet.
Those are domestic producers, they could sell those inventories, domestically, abroad, the point is its domestic production. When they make the sale and move that inventory off the shelf, if it goes abroad, it's no longer an inventory, but now an export.
This quarter does show less demand for imports and if you look at the "real demand" graph, it's so much stronger than last quarter overall. Keyword "dependency" is another kettle of fish, so if you click on trade deficit reports there you can find the monthly import totals. Less imports of oil, less "dependency" of it, but define "dependency".
It could mean overall less demand vs. any sort of shift to domestic production, so one needs to look at domestic production as well as overall energy. i.e. did people switch to ?? solar panels instead of electric, you wouldn't see that shift w/o looking at total energy consumption/usage for a month (or 3) and then determine overall demand.
From the increase in PCE (C), I'd claim it does imply we're producing more and the IP numbers reasonably correlate. To see individual categories, products, NAICS codes,
all of the economic reports I overview, always with links to the corresponding government website/database where you can obtain more details.
This is the GDP report, it's the "macro kahuna" but what went into it is from other more detailed monthly report.
Hey, you won't see me claim that magically our trade deficit is going to reduce, this is just for that quarter, which is a good thing, but I already wrote some overviews on the trade deficit projected increases, so this probably will not last.
GDP isn't static, this is a 3 month snapshot and it's the advance report, odds on a host of these components will be revised.
Increase in GDP should matter to main street because there are employment multipliers, for every 1% increase in GDP is a corresponding increase in future employment...
*that* said, we've already written how Okun's law is broken on this site and I will assuredly do another "where are the jobs" post soon.
So, in other words, due to a host of reasons, while in the past this should indicate a lot of jobs....it's not.
But this does matter to main street as well as Wall Street. You cannot have job growth without a humming economy.
The "real economy" matters to main street.
GDP / Employment / Main Street
Robert,
Yes, you're correct, the economy does matter to Main Street. And yes, increases in GDP does mean that our workforce is not idle.
But.............
First, the GDP is not an indicator of our economic well-being, nor is it an indicator of our dependency on cheap foreign imports. Secondly, Wall Street reacts to the GDP numbers, but rarely do those surviving off of government assistance programs and unemployment checks. And thirdly, the GDP numbers do not mean that we're producing more of what we use and consume.
Technology and innovation has enabled us to produce more with less manpower. During peak production, employees work more hours, and employers hire temporary help. The GDP numbers do not correlate to the overall employment picture, nor do they indicate a difference in the number, or value, of living wage opportunities for our diverse workforce. So, what exactly is the meaning of GDP numbers on Main Street America?
In order for increases in the GDP numbers to have real and significant meaning on Main Street, they must coincide and run parallel to meaningful increases in employment, and a significant reduction in our import dependency. Again, increases in GDP does not mean that we're taking back lost industries and once again providing living wage opportunities for our diverse and growing workforce.
Also, how much of the increase in GDP is for domestic markets, and how much is exported? Are we actually demanding and buying more U.S. made products? What does the increase in GDP tell us about our competitiveness in global markets?
While day traders and Wall Street react to GDP numbers, Main Street America reacts to their precent economic nightmare, and the realization that there aren't enough living wage jobs to satisfy the need.
Because you can do wrong, and get away with it, doesn't make it right
GDP is domestic
Firstly, I think you are confusing GDP. GDP is domestic production. On employment, there is something called multipliers. GDP has a correlation to employment, called Okun's law. That said, it has been diverging and I believe that's due to offshore outsourcing, increases in productivity (which is a combo of elements).
For example, on Stimulus myself and other economic bloggers railed on it due to the refusal to add buy American and hire America requirements for funding and much of the Stimulus was not "Stimulative". There's an example where taking GDP multipliers isn't going to work for increased employment because they are busy not keeping temporary stimulus within the U.S. borders. There are also different multipliers for different things, case in point tax cuts are not very stimulative.
The breakdown of how much is exports is right in this post. The percentage point spread was 0.22 or not a lot. It was the deceleration of imports that made the difference.
GDP is one economic indicator of economy activity. Here is the last post on Okun's law and it looks like I need to update a new one on the correlation of GDP to jobs.
Not Confused
Robert,
Yes, correct, GDP is domestic. No, I'm not confused.
At a time of economic crisis such as we're experiencing now, GDP numbers are nothing more than fodder for Wall Street. While they do indicate output, they indicate little else.
Examples :
(1) If GDP output increased by 2.0% in one month, what would it tell us about the overall state of the economy?
(2) If GDP output decreased for 3 out of 6 months, what would it tell us about the overall state of the economy?
(3) If GDP output increased for 3 consecutive months, but no other economic indicators moved, what would it tell us about the direction the economy was moving towards?
(4) If GDP output increased for 12 months, yet, unemployment remained high, trade deficits increased, and consumer spending remained weak, what would it tell us about the economic conditions on Main Street?
In order for GDP output to indicate economic strength or weakness, it must be accompanied by supporting data such as employment, trade deficits or surpluses, consumer buying habits, commercial investment, and domestic demand for domestic products and services.
Because you can do wrong, and get away with it, doesn't make it right
that simply is not true
What it tells you on the state of the economy is current economic production, just as the title states. Gross domestic production. That does imply job growth, the question is more what percentage? 3-6 months tells you the economy is growing.
I getting kind of tired of this. Are you upset because Q4 GDP was 3.2%? By the ratios, a 3.2% quarter or even a 2.9% year is assuredly not enough for 400,000 jobs per month.
To maintain the status quo, the current multiplier ratio, or rule of thumb is about 2% annualized GDP growth.
Read GDP, Productivity and Offshore outsourcing. It's from 2009, but still relevant.
Not Upset In The Least
Robert,
Why would I be upset? Since you're tired of this conversation, I'll end it here.
Thanks for your time and input.
Because you can do wrong, and get away with it, doesn't make it right
GDP Off-Set By Trade Deficit
Robert,
** A Side Note :
President Obama talked about doubling exports in the State of the Union Address last night as a strategy to create jobs. It's a great sound bite, but woefully incomplete economics. While exports support American jobs, imports displace them; when imports grow faster than exports, our trade deficit expands and American jobs are lost. Between 2001 and 2007 (both business cycle peaks), we lost 3.4 million U.S. manufacturing jobs, and the fact that the trade deficit as a share of GDP rose by roughly one-third is a key reason why. Lately, when the president has talked about jobs and trade, he mentions the jobs associated with exports but ignores those lost due to growing imports. It's like watching baseball, but only counting runs scored by the home team—lots of fun, but it won't tell you anything about who is ahead.
[ January 26, 2011 - http://www.epi.org/analysis_and_opinion/entry/exports_and_jobs_less_than... ]
------------------------------------------------------------------------------------------------------------------------
GDP numbers do not reflect a host of economic data that reveals the true picture of our problems. GDP does show increases/decreases in production, and should be reported along with supporting data on employment, domestic consumption, the ratio between GDP and imports, and the reason(s) for any increase or decrease.
Inventories, seasonal demand, cost of living ( energy, food, etc. ), spendable income in the pockets of consumers, interest rates, technology and innovation, new products and services, the availability of capital on balance sheets, etc., all influence GDP numbers.
GDP numbers do reflect demand for products and services, but are incomplete without supporting economic data.
Because you can do wrong, and get away with it, doesn't make it right
Look in the forums under Macro Economics
You will find overviews on all sorts of economic reports and data. This report has some personal income in it, but it's the aggregate, not the median. I like to break it up to focus on just GDP breakdowns. The Labor Economics link has the unemployment report overviews where I dig around to locate the missing and not counted from the BLS data.
I just wrote State of the Spinon as quite the slam on Obama and his corporate lobbyist talking points. Even Krugman noticed the stir, repeat on the same lobbyist lines claiming bad trade deals create jobs. They said the same thing about NAFTA, yet it only by reading these trade deals can one see the details and see how they will be more offshore outsourcing, job loss.
In the Saturday reads, Public Citizens job losses on the Korea FTA by State.
If there is anything in this report that really should wake people up, is how much the trade deficit affects domestic economic growth.
But the numbers are what the numbers are, and I'm not sure what all these comments are about, do you wish to ignore the statistics? This site is all about statistics, including GDP.
Ignoring Nothing
Robert,
No, I do not ignore statistics. And, yes, I do understand that this site is all about statistics. I believe that you've explained that point very well several times.
My comments were meant to be additions to the information that you provided.
Trade deficits do adversely effect economic growth, which GDP numbers fail to include. My comments were meant to express points which show that GDP numbers alone, do not fairly represent the overall economic picture.
I was only adding to what you had presented. I'm in agreement with your take on the situation.
Because you can do wrong, and get away with it, doesn't make it right
GDP does include trade data
That's the point of this post. I'm writing up those numbers trying to show that just a sudden deceleration in imports for 1 quarter increased GDP growth the most and that is with a massive deceleration of private inventories.
I'm linking to posts showing the decorrelation of long held multipliers and relationships between GDP and jobs and pointing to some of the reasons why. That said, a reduction in a multiplier does not mean there is no multiplier or correlation.
In your comments it seems you are missing the point of the GDP equation and understanding how national accounts are glorified bookkeepers, how they are subtracting off imports/exports and how GDP is calculated.
Not surprising, frankly to understand how a deceleration of a GDP component, it's slope, it's change, is hard to get. I mean you've got an increase in inventories, absolute, but it's that rate of change which affects the GDP....because that also is a rate of change, not an absolute quantity.
Growth = Change, Contraction = Change.
Quarterly GDP data is annualized, and it's also a rate of change. So, "GDP grew 3.2% last quarter" means at an annualized rate, the change was 3.2% from last quarter. The entire report is change, ratios.
Again, trade data is in the GDP calculation, it's a huge component and it shows how trade deficits negatively impact gross domestic product.
That's why I print the basic GDP equation and break it all down based on that equation.
Where do All of These Graphs Come From? Answer: FRED
I've been seeing a lot of regulars don't know where the graphs come from.
Graphs have titles at the bottom. I use, extensively the awesome, wonderful and free tool from the Saint Louis Federal Reserve research division FRED. This database has some awesome graphing capabilities where one can create custom graphs, which are what is in this post.
They also have the ability to download the raw data after you have customized it, which is really useful to make sure you're graphing what you think you are graphing.
Most graphs, although sometimes we miss it, if they are created originally from raw data, put the site URL in the bottom to identify who made it.
The St. Louis FRED graphing and database is simply fantastic, it's accurate, fast and one can create custom graphs for your data almost on the fly.
So, if you're looking for graphs and just plain don't know how to create them from scratch, you might check out this research tool the St. Louis Fed has created for public use.
They do not have all data and there are limits, but you can narrow down a lot of data to create a graph in Excel if you've hit the limits of what their tool can do.
Seriously, who says the government isn't web savvy, the St. Louis Fed has blown away any Google API!
To sum on graphs:
1. FRED
2. custom, often using Excel graphing capabilities and spreadsheets
3. borrowed from others, but always cited to show where the graph came from
the site actually does have the ability to create minor graphs from data but you need to use those LaTex tools and it's not very good.
If someone sees a new API, or server side graphing tools that actually work and are easy to use, let me know and I'll incorporate them on the site.
To date, almost everything I've checked out is more of a pain to use than the above methods and I think that's the last thing people need is to become a programmer in order to create a graph on some economics related data.