
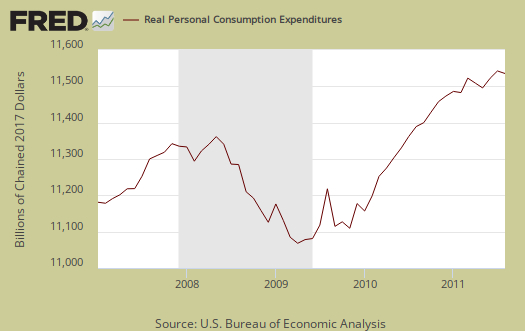
The Personal Income and Outlays report for August covers individual income, consumption and savings. Overall the report shows America flatlining again economically. Personal consumption expenditures, called by the press consumer spending, increased 0.2% and in real dollars, flat lined, zero change from July to August. Real Personal Consumption Expenditures, or PCE, are about 70% of GDP. Real means chained to 2005 dollars, or adjusted for inflation. Below is a graph of real PCE. This report is also bad news for economic growth, or GDP in Q3.
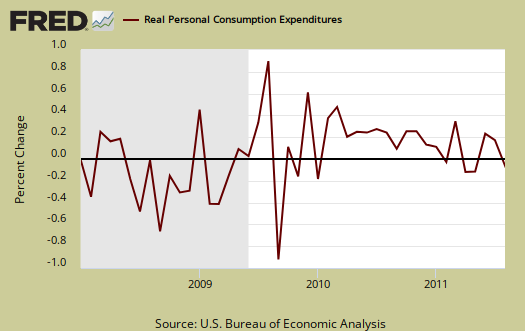
Real consumer spending was revised down to 0.4% monthly change for July and June was revised up -0.1%. Graphed blow is the overall real PCE monthly percentage change:
The PCE price index increased 0.2% for the month, but minus energy and food increased 0.1%. The energy index increased 0.2% in for August and is up 19.6% for the year. This price index represents inflation, and is different from CPI. The price index is what is used to compute real consumer spending, or spending adjusted for inflation.
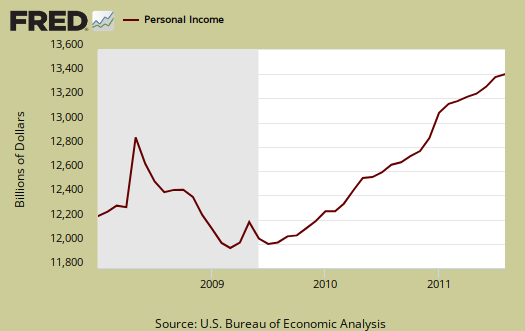
Personal income decreased -0.1% in August. Below is personal income, not adjusted for inflation, or price changes.
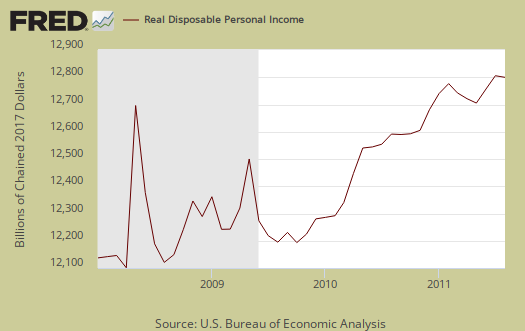
Real personal income, or personal income adjusted for inflation, the PCE price index, decreased –0.3% for August. Below is the graph of real personal income. While personal income is everybody, all income in the U.S., we can see it's below pre-recession levels when adjusted for inflation.

Disposable income is what is left over after taxes. DPI (disposable income), flat lined, or was zero change from July to August. DPI adjusted for inflation (see the price indexes above), decreased -0.3%. These numbers are aggregates, which includes income of the uber-rich. This report shows people are really hurting financially.
Below is real disposable income per capita. Per capita means evenly distributed per person and population increases every month. August mid-month the U.S. population was 312,899,000 and increased 245,000 from July.
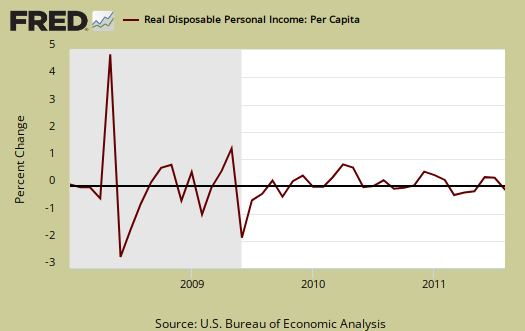
Pretty flat monthly change huh? Even an increase in personal income, when spread across increased population growth and adjusted for inflation shows it's often not great news, which makes declines even more miserable. The numbers reported in the press headlines are aggregates. Aggregate means the total.
Wages and salaries, not adjusted for inflation, decreased –11.8% at annualized rates, from last month. Annualized means what this month's increase would look like if it happened for an entire year. Last month's annualized rate was revised to a 22.0% increase. The monthly percentage change for wages and salaries was –0.2%. This is not good news for economic growth, as well as working people.
Private wage and salary disbursements decreased $12.2 billion in August, in contrast to an increase of $23.8 billion in July. Goods-producing industries' payrolls decreased $1.3 billion, in contrast to an increase of $6.3 billion; manufacturing payrolls decreased $2.9 billion, in contrast to an increase of $5.8 billion. Services-producing industries' payrolls decreased $10.9 billion, in contrast to
an increase of $17.5 billion. Government wage and salary disbursements increased $0.4 billion, in contrast to a decrease of $1.8 billion.
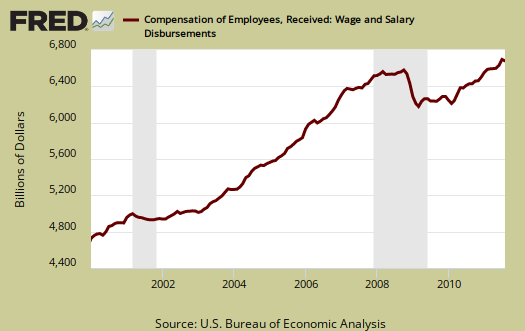
Below are wages and salaries for the past decade. Notice the dip and the more flat line than earlier in the decade. Bear in mind these are aggregate, or all wages and salaries, and not adjusted for inflation.
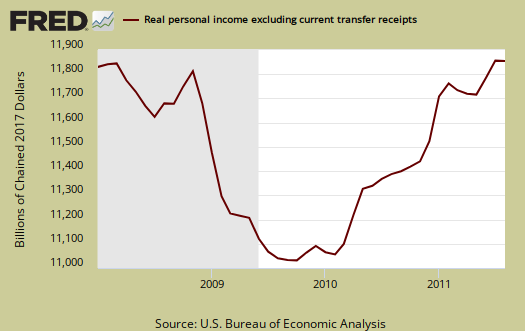
Below is personal income minus personal current transfer receipts. This graph shows how much personal income increased that wasn't funded by the government and is used as a recession indicator. Transfer receipts are payments from the government to individuals where no actual services (work) was performed. This includes social security, unemployment insurance, welfare, veterans benefits, Medicaid, Medicare and so on. This month, in chained 2005 dollars, real personal income minus transfer receipts dropped -0.2%. Notice real personal income minus transfer receipts is below pre-recession levels.
The Personal Savings Rate was 4.5% in July. Personal savings is disposable income minus outlays, or consumption and not adjusted for inflation. What this implies is people dipped into savings to make up for lost income.
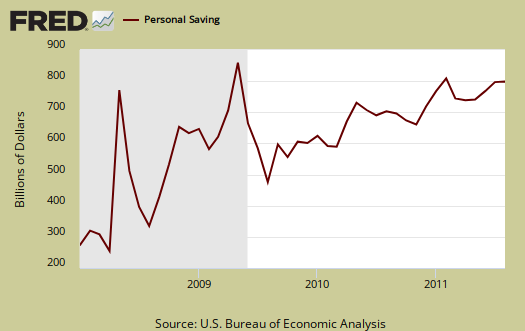
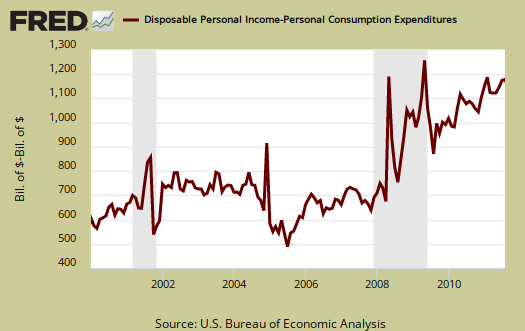
Below is disposable personal income minus personal consumption expenditures monthly raw total changes.
Personal Outlays are PCE, personal interest payments, and personal current transfer payments. PCE is defined above by percentages is almost all of personal outlays. Personal interest payments are things like the interest you pay on your credit card. Personal transfer payments are defined as:
Payments consisting of transfer payments by persons to government and to the rest of the world. Payments to government include donations, fees, and fines paid to Federal, state, and local governments, formerly classified as "personal nontax payments."
In other words, personal transfer payments are nothing more than that speeding ticket you just got or how you just donated to this site.
To visualize more data from this report, consider playing around with more of the St. Louis Federal Reserve Fred graphs.
Here is July's report overview, unrevised. The June revisions in this report are already incorporated into the Q2 GDP 3rd revision.
Isn't the title technically a
Isn't the title technically a double-negative?
and so.....
why do people only comment on perceived spelling and grammar mistakes? I believe it's because they cannot understand article content.
There are three main data pieces in this report, none good. The title simply lists two of them and is a government statistical economic data release overview.
Thanks for the Link Naked Capitalism
NC linked to this post and I am glad. I actually missed this report (sorry) and when I read it, decided to write up an overview, pretty much two days late.
It really ain't good at all here, and while a month is simply a month, yet another indicator of declining disposable income for consumers is truly not a good thing.
Goods also dropped more than services, which to me shows people are stones, simply no extra money after making rent and filling their gas tanks.
personal income
Well said, but missing a few details.
1. Population is increasing by about a quarter of a million per month. This is not an act of God, its government policy to increase population rapidly to keep competition for jobs high, wages low, and profits high. Surely this deserves a mention.
2. As far as per capita income, remember, because of government mandated increases in population, stable per-capita income is not neutral. With a stable population a stable per-capita income would be OK. With a rapdly increasing population you need per-capita income to be increasing even faster, because new people need massive new capital investments. That's why with 1%/year population growth, the United States needs 4%/year economic growth just to keep even.
We're one of the few economic sites
That deals with the realities of population, immigration to wage, labor arbitrage and how it correlates to stats, esp. employment, labor markets.
So, yes you are right and considering the sad state of U.S. labor it's obscene to watch them try to flood it more, now trying to turn labor economics on it's head, claim up is down and this never ending increased in labor supply isn't causing labor displacement, wage repression.
on the per capita PI, that's divided by population, mid-month, so it's taking the new increase into account, which is why I show the graph on that one.
Thank you for going through
Thank you for going through all this. I will use this information to validate what I have been telling everyone. In a nutshell people are sacrificing their future to continue to spend, spend, spend. As a society, we have not learn save for the future and forgo the pleasures that tempt us on a daily bases. Starbucks, Panera Bread and Apple are among a few retailers that people have to have, probably just to fill good about themselves.
I have been surprised how well the retailers have been performing through this slow recovery and I could only conclude that people are dipping into their savings to spend on goods for thier family. Perhaps this is why we have a consumer conundrum, where retail sales are increasing while at the same time consumer sentimate is falling.