
January New Residential Single Family Home Sales soared 15.6%, or 437,000 annualized sales. Single family new home sales have not been this high since July 2008. Housing inventory is at a 4.1 month supply. Inventories haven't been this low since March 2005. Beware of this report for most months the change in sales is inside the statistical margin of error and will be revised significantly in the upcoming months.
New single family home sales are now 28.9% above January 2012 levels, but this figure has a ±21.7% margin of error. A year ago new home sales were 339,000. Sales figures are annualized and represent what the yearly volume would be if just that month's rate were applied to the entire year. These figures are seasonally adjusted as well.

The Northeast region saw a 27.6% monthly increase in new single family home sales with an error margin of ±97.9%. In other words, the error margin is so large, the monthly percentage increase in the Northeast is assuredly wrong for January. The Midwest region saw a monthly new home sales surge of 11.1% but has a ±42.9% margin of error. That's almost a 50-50 chance of being right. Bottom line this report has a lot of statistical noise.
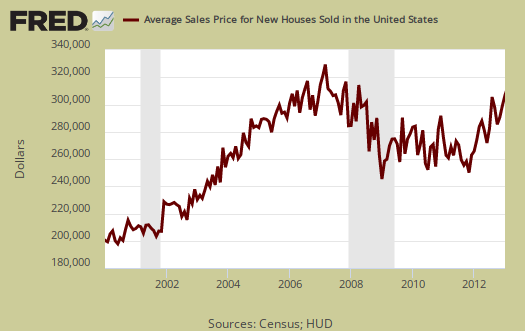
The average home sale price was $286,300, a -5.0% drop from last month's average price of $301,500. If one thinks about it, these prices are outside the range of what most wages can afford.
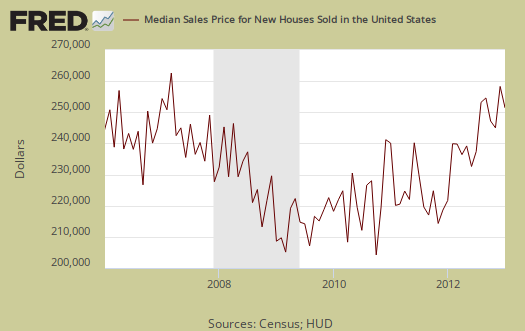
January's median price dropped -9.4%, from $249,800 to $226,400. Median means half of new homes were sold below this price and both the average and median sales price for single family homes is not seasonally adjusted.
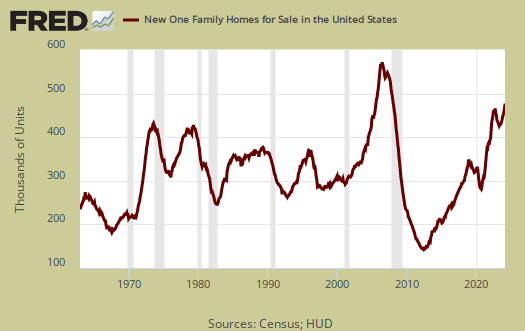
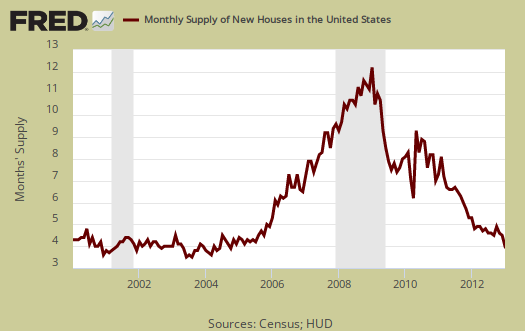
Inventories are hitting record lows. The current supply of new homes on the market would now take 4.1 months to sell, a -14.6% decline from last month's 4.8 months to sell. The amount of new homes for sale was 150,000 units, annualized and seasonally adjusted. From a year ago housing inventory has declined -22.6% and is above the margin of error of ±14.1%.
Below is a graph of the months it would take to sell the new homes on the market at each month's sales rate. We can see these inventories vs. sales times have plunged in a nose dive, even from a year ago.
The median time a house was completed and on the market for sale to the time it sold was 4.7 months, an increase from December's 4.6 months.

The variance in monthly housing sales statistics is so large, in part, due to the actual volume declining, along with the fact this is a survey. One needs to look at least a quarter to get a real feel for new home sales, but a year of sales data is more in order. Additionally this report, due to it's huge margin of error, is almost always revised significantly the next month. Buyer beware on month to month comparisons and reacting to primarily figures and why we graph up the statistics so one can identify a real trend versus press headline buzz.
What we know for certain about new homes sales are increasing from the year ago change. We also know inventories have plunged. Finally, we also see new single family home prices becoming out of reach for most families by income again. We list the margins of error for they are usually above the monthly reported percentage changes. The Census notes that the average revision is about 5% of the original reported.
Here is our overviews of residential real estate statistics, only some graphs revised.
Surge in home sales
Total BS and when is this tabloid going to wake up
tabloid? that's a first
Throughout this overview and we do statistics by the book, like it or not, are warnings on the validity of this particular report. Read it and you will see, and we are the only economics site doing overviews which amplifies the margin of error for this reason.
Also, you see comments on how these prices are not affordable. We are assuredly not residential real estate porn or in the tank for the NAR, promoting the claim oh, a return to the housing bubble is all good.
Forbes is an economic, finance tabloid, plenty of lobbyist generated articles there, not here.
home sales
"JPMorgan Chase & Co., (NYSE: JPM) the largest U.S.-based bank, plans to reduce headcount by as much as 19,000 people in its mortgage and community banking businesses by the end of next year"
Of course all these people will be looking to move up to buy those 'new' homes.
Makes sense to me!!!!!!!!!!!!
Wall Street Executive Pay $20 Billion with layoffs galore
This is the wrong place for this but to respond, WSJ, executive pay up 8% from last year while layoffs keep coming.
In other words they are just raping the coffers while firing even more people to do so.
home sales surge
i think these numbers are complete bulls**t
i believe the banks (saved and funded by the american taxpayer) are keeping loads of distressed inventory off the market to drive prices up.
We live in a walmart nation where that particular company is the countries largest employer and outside of their management employees must are paid non-livable wages. U get my point.
I agree with this article that to help the "middle class" or whats left of it is to allow these homes to deflate to prices which the newly underemployed american can afford. That would be a real housing recovery.
these are new home sales
Not existing home sales. I usually dig into shadow inventory on existing home sales, but considering the unemployment rate it does seem hard to believe. That's why one needs to look at the graphs. While the surge is from last month, the volume overall is way below 2006. Surge is relative.
Yeah, I know we're all broke, how can anything "surge" under those circumstances.