
The S&P/Case-Shiller Home Price indexes for September 2010 were released today. Nationally, home prices have dropped back to their 2003 levels. The lowest point in home prices was Q1 2009 and prices have risen 4.9% nationally since that time (but declining this month).
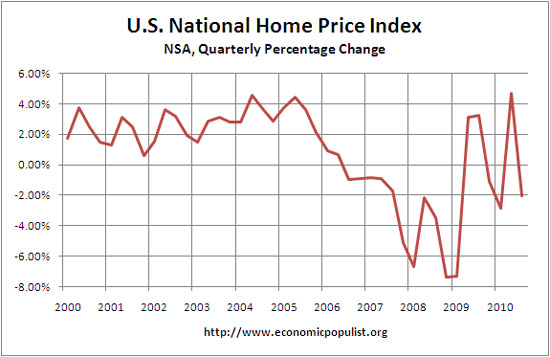
The U.S. National Home Price Index declined 2.0% in the third quarter of 2010, after having risen 4.7% in the second quarter. Nationally, home prices are 1.5% below their year-earlier levels. In September, 18 of the 20 MSAs covered by S&P/Case-Shiller Home Price Indices and both monthly composites were down; and only the two composites and five MSAs showed year-over-year gains. While housing prices are still above their spring 2009 lows, the end of the tax incentives and still active foreclosures appear to be weighing down the market.
Below are the 20 city and 10 city S&P/Case-Shiller monthly indices.
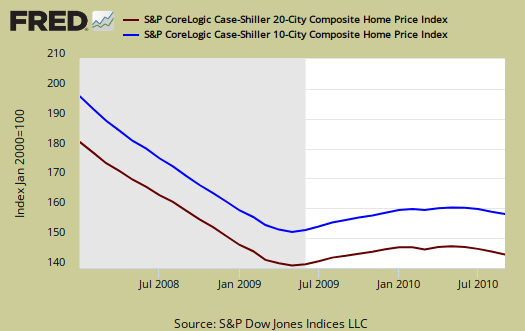
From the peak in 2006, now the 10 city index is down -28.7% and the 20 city index is down -28.6%. Their report analysis finally blames the economy instead of the loss of a tax credit and the report is fairly bleak.
Looking deeper into the data, in the monthly indices, 18 MSAs and both Composites were down in September over August. This is worse than August when 15 were down month-to-month. The only two which weren’t down in September were Las Vegas, which managed to stay a touch above the low set in July, and Washington DC. Overall, there are few, if any, good numbers in this month’s data.
S&P does a great job of making data available for further information and analysis on their website.
Recent comments