
This is the concluding installment in my series examining how the most reliable economic indicators during the Inflationary Era, perform during periods of deflation. I have done this by examining the Roaring Twenties, Great Depression, New Deal, and the Post WW 2 deflationary recession. The reason for doing so is that we are now in the midst of the first deflationary recession in 60 years. Most indicators used by economists and pundits do not exist or have never been tested that far back in time. Indicators which may work during inflations may not work during deflations. Having set forth the data for you, today we show exactly how two such indicators -- monetary and interest rates -- panned out, and the implications of those conclusions to our present situation.
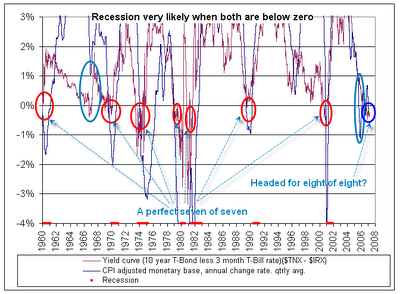
During the period from 1960-2008 there were 8 recessions. One predictor -- the Kasriel Recession Warning Indicator (or KRWI) -- had a perfect 8 for 8 record with no false positives. When it signalled a recession, one started shortly thereafter. When it did not signal a recession, no recession started. The KRWI has two components, (1) the interest rate component. Was the yield curve in the bond market inverted (i.e., di longer maturity bonds like 10 year treasuries pay less in interest than short term 3 month bonds or the Federal Reserve overnight rate?; and (2) the monetary component. Is consumer inflation as measured by the 12 month CPI higher than the M1 money supply? If both of those yield a "yes" answer, then the Indicator is triggered.
It also appear that the converse has also been true. From 1960 to 2007, if the answer to both questions is "no," then the economy is not in a recession or is just ending a recession. Here is a graph showing that performance:
In Part II we examined the monetary component of the Indicator during the Roaring Twenties. In Part III we examined the monetary component in the 1930s and the 1948-49 deflationary recession. In Part IV we examined the yield curve from 1920-1950.
Part V. Conclusions and Predictions
Now that we have completed our examination, how did the components of the KRWI perform during the period of 1920-1950? Here is the combined result. Where the Indicator was triggered by one component or the other, the month that the indicator was triggered is indicated to the right:
| Recession Time Period | Inverted yield curve | CPI > M1 |
|---|---|---|
| 1/20 - 7/21 | YES 1/19 | YES 1/20 |
| 5/23 - 7/24 | NO | YES 9/23 |
| 10/26 - 11/27 | YES 1/26 | NO |
| 8/29 - 3/33 | YES 10/26 | NO |
| 5/37 - 6/38 | NO | YES 6/37 |
| 1/49 - 10/49 | NO | YES from 1945 |
Our examination shows that in only ONE of the 6 recessions from 1920-1950 did the KRWI correctly signal recession -- the post WW1 deflationary recession of 1920-21. In all other cases, one of the indicators is missing. So the KRWI, in its Infaltionary Era formulation, does not work. Deflationary recessions, as it turns out, are different.
Just as interesting, however, is that in each of the other 5 recessions, one or the other of the two components was triggered. The monetary indicator was triggered for 1923, 1937, and 1948 (although in the last two cases, the indicator did not anticipate the recession, but coincided with the onset of the recession). The inverted yield curve was triggered in 1926 and, spectacularly, in 1929.
In fact, at no point did either the monetary or the yield curve indicator give a false signal. When either one was triggered, a recession followed.
As I have previously indicated, all the deflationary recessions followed a pattern. The CPI declined from the beginning of the recession and its YoY rate of decline bottomed immediately before the recession's end. M1 followed a similar pattern, sometimes coincidentally, sometimes leading slightly. Like a roller coaster reaching the bottom of a decline, the indicator that the bottom is at hand is that the coaster continues to decline, but declines at an ever decreasing rate! In all 6 of the deflationary recessions during our study period of 1920-50, once M1 and CPI both declined at a decreasing rate, the recession was about to end. In visual terms, deflationary recessions are like wry smiles (left, the 1937-38 recession) vs. inflationary recessions which are like mouths agape (right, the 1970 and 1974 recessions).
. . . . . . . .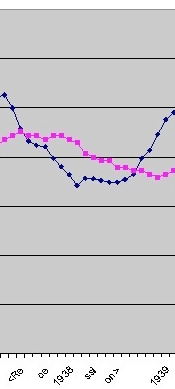 . . . . . . . . . . . . . .
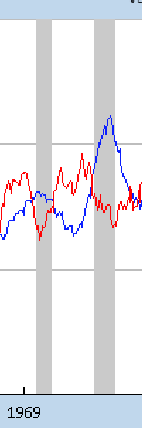
During inflationary recessions, CPI tends to be rising before and at least 3-4 months into the recession, which is why M1's decline is a leading indicator; in contrast, during deflationary recessions, CPI falls immediately and somewhat in sync with M1, so M1 generally does not lead.
Now let us turn our attention to our own situation. You may recall that in Part II I said to keep in mind the period of time when M1 was either flat or declining at an increasing rate during a period of deflation. In Part IV, I noted the ominous pattern of an inverted yield curve with very high "real" interest rates during a time of CPI deflation. Have either or both of those patterns happened since? The answer, with one slight modification (quarterly vs. YoY deflation), is YES. The pattern has recurred exactly one time -- in 2006. Here is the graph:
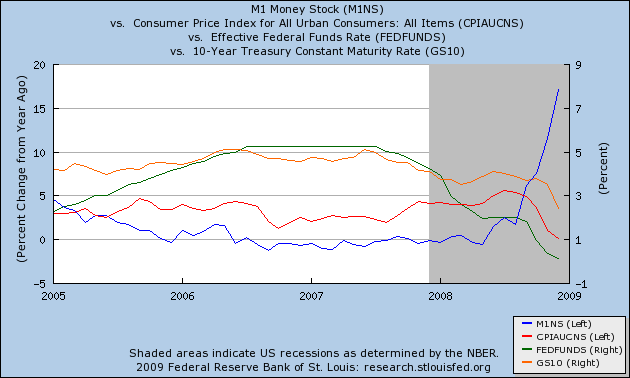
In 2006 as for several years before, M1 (blue) was essentially flat, just as it was in the 1926-29 period. The yield curve(green Fed funds rate over orange 10 year Treasury rate) was inverted, with Fed Funds rates of 5.25% being at one point ~3.5% above theYoY inflation rate. Although the YoY inflation rate at that time was positive, the period featured a quarter during which deflation actually occurred, in the amount of (-1.1%) -- the most deflation in half century at that point. On this basis the yield curve in 2006 was giving almost the same ominous reading as it did in 1928-29.
So what do the indicators portend for the future? A couple of weeks ago, I gave a Deflation Outlook for 2009, including both optimistic and pessimistic scenarios. I have prepared a graph of M1 and CPI incorporating both of those scenarios, here:
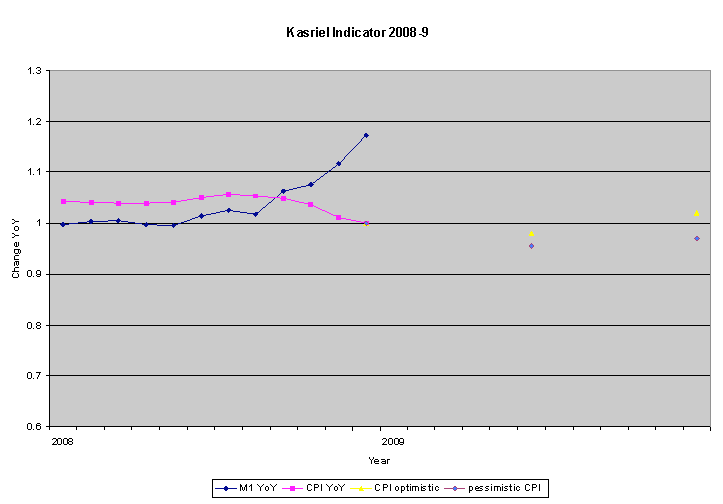
The graph indicates that it is very unlikely that YoY CPI will bottom out before the middle of the year, although under the optimistic scenario in particular it appears the bottoming will at least take place shortly before or after. Thus, if M1 continues to expand, in the face of the positively sloped yield curve from 2008, the indicators we have studied from the earlier Deflationary period suggest that the recession might bottom out in about Q3 (the graph would look very much like the 1937-38 recession).
If, on the other hand, the pessimistic scenario unfolds, and if in particular wage cuts (including "stealth" wage cuts via, e.g., reduced workweeks) feed into a cycle of increasing demand destruction, then the CPI may continue to decline into a very bad situation indeed.
Comments
Thanks for an enlightening series
I learned a great deal and your last paragraph above reminds me of what my grandparents told me:keeping wages stable during the Depression is better than cutting wages which can contribute to the uncertainty and delayed demand excerbating the problem
That makes me wonder
If a better form of "unemployment/underemployment" insurance is needed. Something that the individual, rather than the employer, purchases/pays into in good times, which makes up for lost wages in bad times.
-------------------------------------
Maximum jobs, not maximum profits.
While you are wondering....
...ask yourself how much help this sort of thing is to independent contractors and the self-employed.
As per usual the gummint is way behind the curve on significant changes in society and the workforce.
There is no wondering to be done on why the Corporate Slave State luvs them some 'independent contractors...' and the Republicrat cartel love to bloviate about 'American small business...', that's me, the self-employed but there is no safety net for me.
Obama and his folks seem no more knowledgeable in this area.
Or am I missing something in the 'stimulus package' which would help me?
'When you see a rattlesnake poised to strike, you do not wait until he has struck to crush him.'
That's part of the reason
Why I'd like to see this, and health insurance, return to individual or at least non-employment group purchasing. You can get something similar on most credit cards right now- but they only cover minimum payments. We need something like Aflac available for the self-employed, but covering unemployment as well as medical.
-------------------------------------
Maximum jobs, not maximum profits.
The EU seems to have the answere here....
....as does Canada.
As long as Americans refuse to demand single payer, funded by the government, we will have a third world health care system.
'When you see a rattlesnake poised to strike, you do not wait until he has struck to crush him.'
Now *that* would be an excellent blog post
Just how many in the U.S. are independent contractors, or 1099-misc. The work performed is services, "employee like" yet not only do they not get benefits and have to provide them as a small business, but they cannot apply for unemployment insurance. Even food stamps is calculated different.
So, how much of the workforce is 1 person "businesses" who are in this situation?
Their median age, personal income, retirement savings, falling through the cracks.
There are other categories too such as the permanent part-time and the underemployed...
Going through the statistics on all of this (not personal story the aggregate data like the above) might shed strong light on the fact that many are not real businesses as presented by the GOP....where somebody is running a deli, has at least $300k gross and can cover all of the costs of business such as retirement, insurances, health.... but instead are screwed over employees that are getting denied their real pay/benefit levels.
Might put in the 2.5 calculation of 1099-misc rate to actual final wages in there too. When someone sees "$40/hr" or whatever, they think "$40/hr" w-2 and all of the benefits associated with it....but $40/hr as a 1099-misc is more like $15/hr in wages.
Permatemp hell zone.
I saw Coulter on Lou Dobbs show and....
...that's' it for me and Lou.
He's not a serious person if he can put her on his show even if he occasionally says something that make sense.
'When you see a rattlesnake poised to strike, you do not wait until he has struck to crush him.'
just write his show
blasting him for such an obvious journalist lapse in judgment. He's the only TV show covering trade, nobody does offshore outsourcing or guest workers (except CNBC who gives air time to some corporate lobbyist), has on Joseph Stiglitz
etc.
But there are moments like the above but if you notice there has to be some sort of arm twisting going on somewhere.
Maybe Time Warner publishes her drivel books and since they own the network force these guys to soft shoe the interview...
I have no idea but yeah, I won't watch her period.
Better picking up a meth crack head off the street and giving their expert opinion on the issues of the day than her. ;)
Thanks very much for reading
We are, alas, living in interesting times, in which the Fed is conducting a gigantic experiment to see if Milton Friedman's theory of the Great Depression was correct or not.
The Great Experiment
might also make an interesting post.
This was exceptional.
Maybe a follow up is wage deflation.