
China Conducts Patrol In South China Sea, Accuses Philippines Of Disturbing Regional Peace
Authored by Alex Wu via The Epoch Times,
The Chinese regime’s navy conducted patrols in the South China Sea from Feb. 23 to Feb. 26, while the United States, Japan, and the Philippines were holding joint military exercises in international waters.
The Chinese regime criticized the Philippines for “disturbing peace” in the region.
Analysts told The Epoch Times that the standoff in the South China Sea does not necessarily mean that the situation will escalate soon, and the Chinese regime’s rhetoric reflects complicated political considerations.
The United States, the Philippines, and Japan this week conducted joint exercises over the Bashi Channel that separates the Philippines from Taiwan in the South China Sea, according to a statement by the Philippine military on Feb. 27. The drills were aimed at showcasing the forces’ “ability to operate seamlessly together in complex maritime environments,” the Philippine military said.
This was the first time that such joint exercises have been conducted in the Bashi Channel.
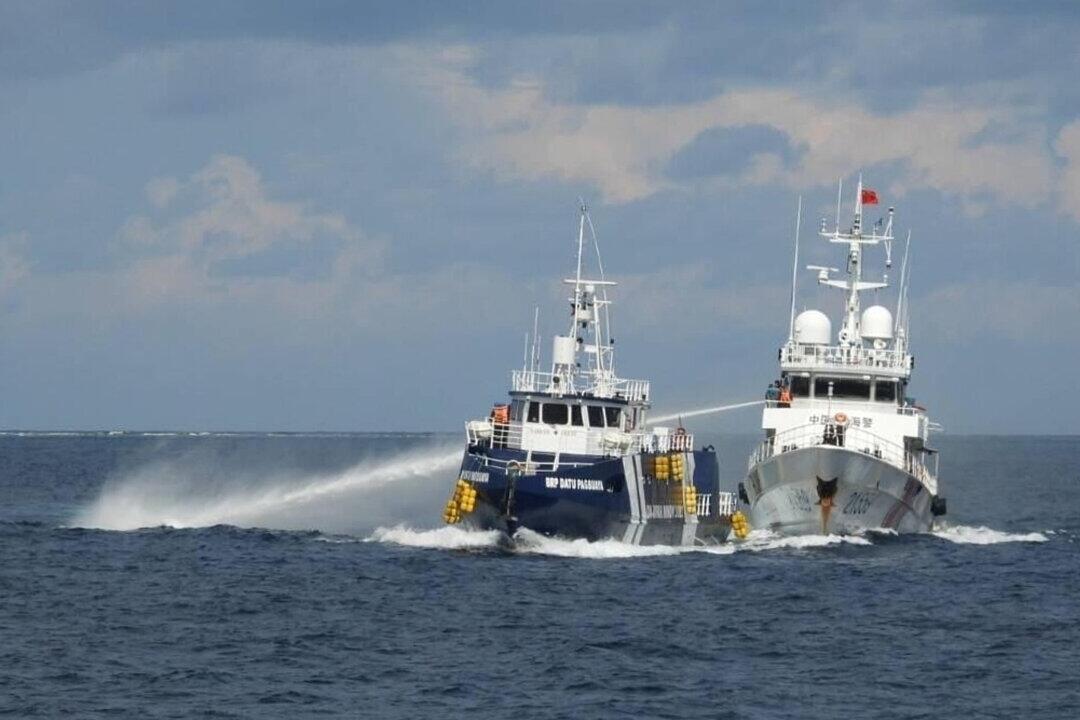
The Chinese regime reacted angrily to the joint drills. On Feb. 27, a spokesperson for the People’s Liberation Army’s (PLA) Southern Theatre Command accused the Philippines of “disrupting peace and stability by organizing joint patrols with countries outside the region.”
China conducted a “routine patrol” of the South China Sea from Feb. 23 to Feb. 26, according to the spokesperson.
While China claims sovereignty over the waters, citing the historical nine-dash demarcation line within the South China Sea, the Philippines, Brunei, Malaysia, Vietnam, and Indonesia each claim sovereignty over their exclusive economic zones in the South China Sea. Some of these zones overlap with each other, with communist China’s nine-dash line, and with Taiwan’s 11-dash demarcation.
On July 12, 2016, an international tribunal ruled that the nine-dash demarcation couldn’t be used by the regime in Beijing to make historic claims to the South China Sea, parts of which are claimed by six governments. China rejected the ruling and has continued to assert its sovereignty claims and operations in the South China Sea.
“China has taken strong measures to drive away ships or fishing boats that enter the area, especially Philippine supply ships,” Shen Ming-shih, research fellow at the Division of National Security Research at Taiwan’s Institute for National Defense and Security Research, told The Epoch Times.
“In such disputed areas, disputes should be shelved. It is because of China’s strong expulsion that the United States, Japan, and the Philippines are preparing for the worst-case scenario.”
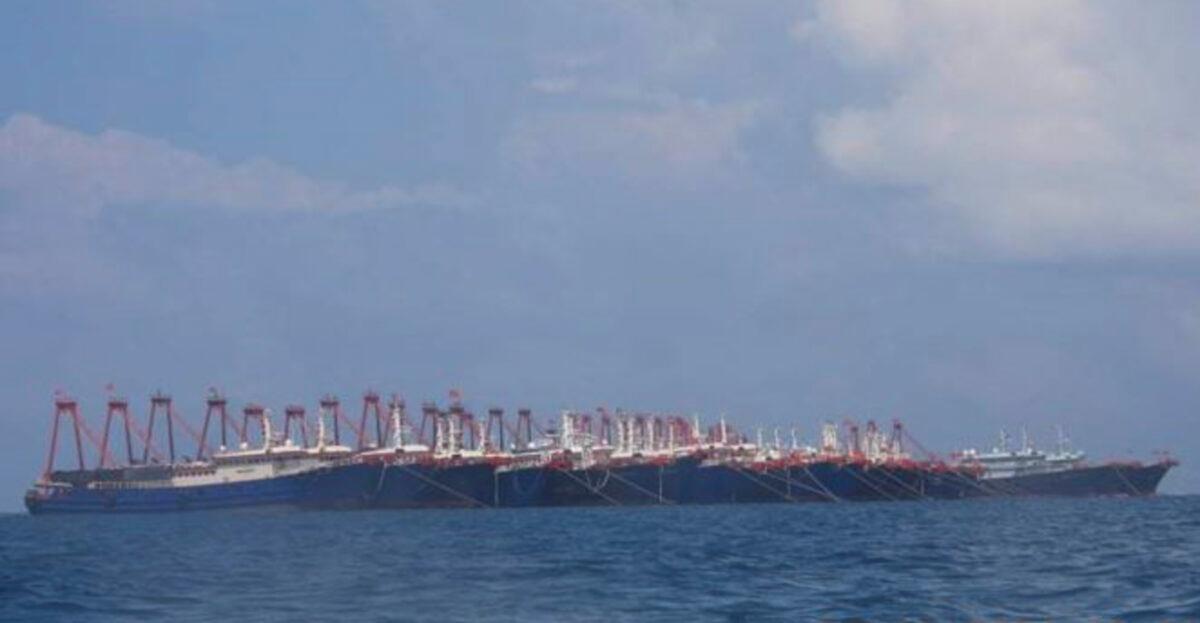
Some of a total of 220 Chinese vessels are moored at Whitsun Reef, South China Sea on March 7, 2021. Philippine Coast Guard/National Task Force-West Philippine Sea via AP
Judging from the joint drills, it’s clear that the United States and Japan are paying particular attention to security in the South China Sea region, Shen added.
Commenting on the joint U.S.–Japan–Philippines drills conducted over the Bashi Channel, Wang Shiow-wen, an assistant researcher at the Taiwan’s Institute for National Defense and Security Research, said, “This may be to test the PLA’s reaction, to see if the PLA has already considered the Bashi Channel and the South China Sea or even the Taiwan Strait as its own.”
As to the PLA’s accusation against the Philippines, she told The Epoch Times: “Why is it that the PLA’s daily harassment of Taiwan under the pretext of ‘exercises and training’ is not considered ‘disturbing peace and stability in the region,’ but other countries’ joint exercises are considered ‘disturbing the regional peace and stability’?”
The PLA spokesperson’s avoidance of directly naming the United States and Japan in its accusation may be laying the groundwork for future joint military exercises between China and Russia, or possibly North Korea, Wang said.
Furthermore, with an April meeting scheduled between U.S. President Donald Trump and Chinese leader Xi Jinping, both sides are currently cultivating a “friendly” atmosphere, making direct criticism inappropriate, she said.
Shen has a similar assessment. “Because the Chinese Communist Party (CCP) is currently hoping to ease tensions with the United States, and relations between China and Japan have already deteriorated, in order to avoid further complications, the Southern Theater Command only dared to condemn the relatively weaker Philippines in its statement this time.”
DeterrenceAs to whether both sides doing military drills and patrols in the South China Sea in the same week might escalate the tension into a conflict, Shen said that “the main policy of the United States is to strengthen the defense capabilities of various countries in the First Island Chain region in order to deter China from easily launching a conflict or war in this region.”
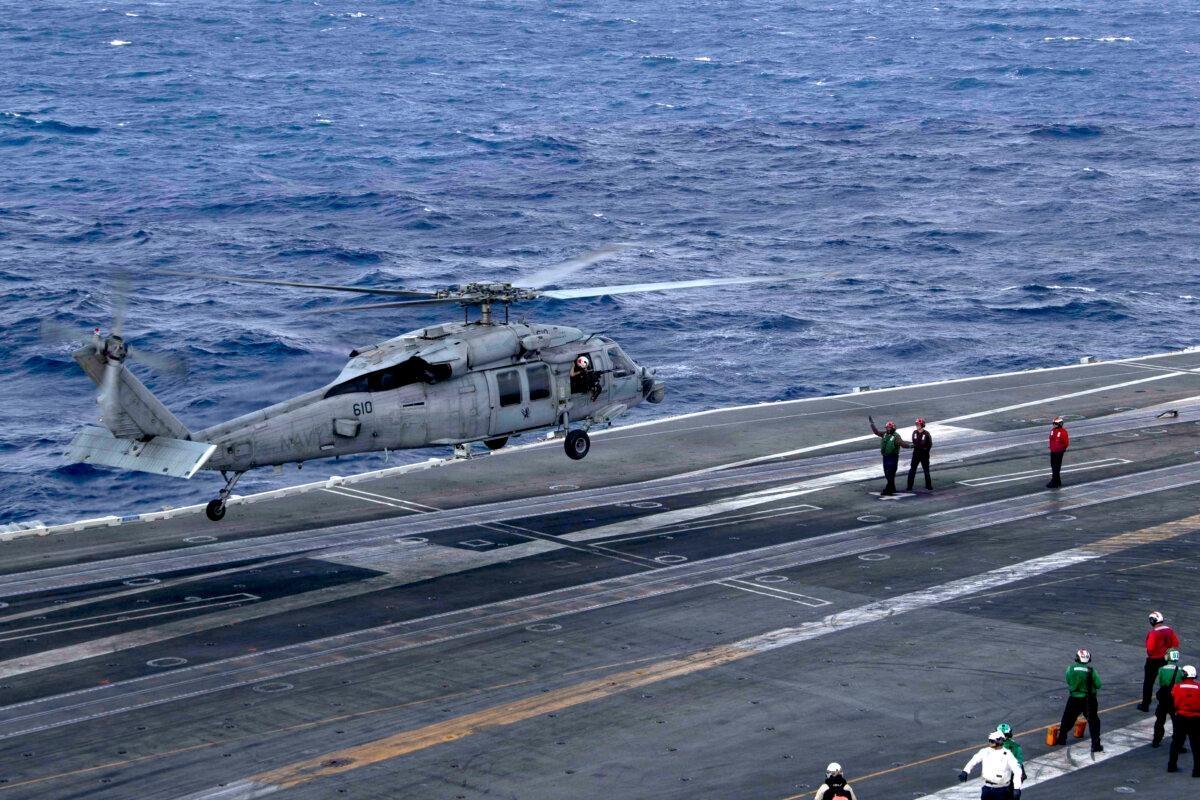
An MH-60S Sea Hawk helicopter, attached to Helicopter Sea Combat Squadron (HSC) 14, prepares to land on the flight deck of Nimitz-class aircraft carrier USS Abraham Lincoln (CVN 72) on Jan. 15, 2026. Mass Communication Specialist Seaman Apprentice Cesar Zavala/U.S. Navy
If war becomes unavoidable in the region, the United States should have many ways to participate. “Ultimately, war with the CCP will only be a last resort. Before that, political, economic, and cyber warfare are already underway,” he said.
Regarding the PLA spokesperson’s statement about China’s need to “safeguard China’s territorial sovereignty” and “uphold regional peace and stability,” Wang said that the Chinese regime is actually saying that as long as the United States, Japan, and the Philippines are not taking Chinese territory, the PLA won’t launch a preemptive attack.
Given the current military strength of the CCP, starting a war is not the problem, according to Wang. “The problem lies in how to sustain and end the war,” she said. “The Russia–Ukraine war has entered its fifth year, which should serve as a great warning to the CCP.”
“If the CCP leader Xi Jinping wants to escape his various domestic crises by starting a war, then it can only be said that he himself has determined the fate of the CCP regime,” she said.
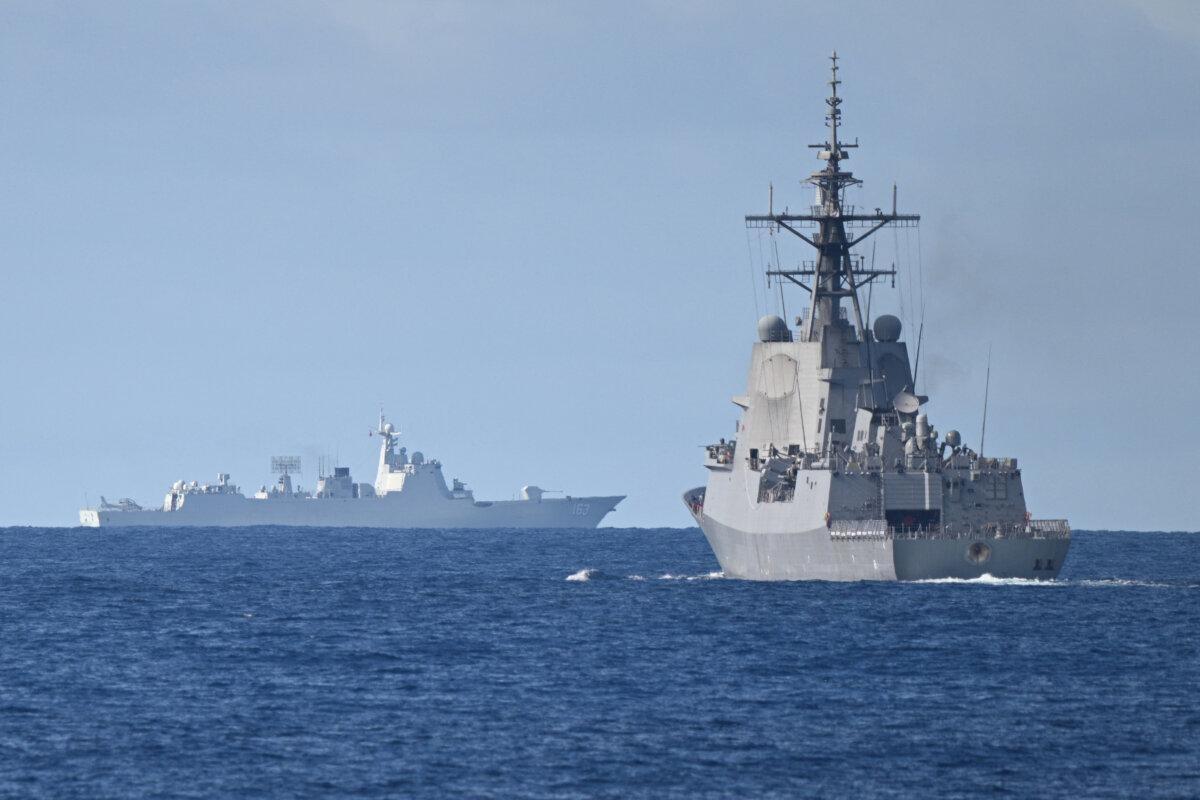
A Chinese PLA Navy ship (background L) is seen while an Australian Navy destroyer (R) takes part in a maritime cooperative activity near Scarborough Shoal, on Sept. 3, 2025. Ted Aljibe/AFP via Getty Images
Shen believes that the PLA’s patrol was routine, saying, “I don’t think it’s likely to start a conflict or war right now.”
“I think maintaining internal stability, conducting the CCP’s Fifth Plenary Session effectively, and balancing the power should be the top priorities right now.”
Shen added that when the internal power struggle within the CCP deteriorates or intensifies, “if [the regime] wants to take actions to divert [the] Chinese public’s attention from the domestic to the international, it might target the relatively weaker Philippines or the South China Sea.”
Tyler Durden Mon, 03/02/2026 - 20:55 Opposition leader María Corina Machado during an interview with AFP in Caracas, Venezuela, on July 25, 2024. Federico Parra/AFP via Getty Images
 U.S. President Donald Trump and Venezuelan opposition leader María Corina Machado in the Oval Office on Jan. 15, 2026. Daniel Torok/The White House/Reuters


Recent comments